Air Canada Reports Fourth Quarter and Full Year 2025 Financial Results
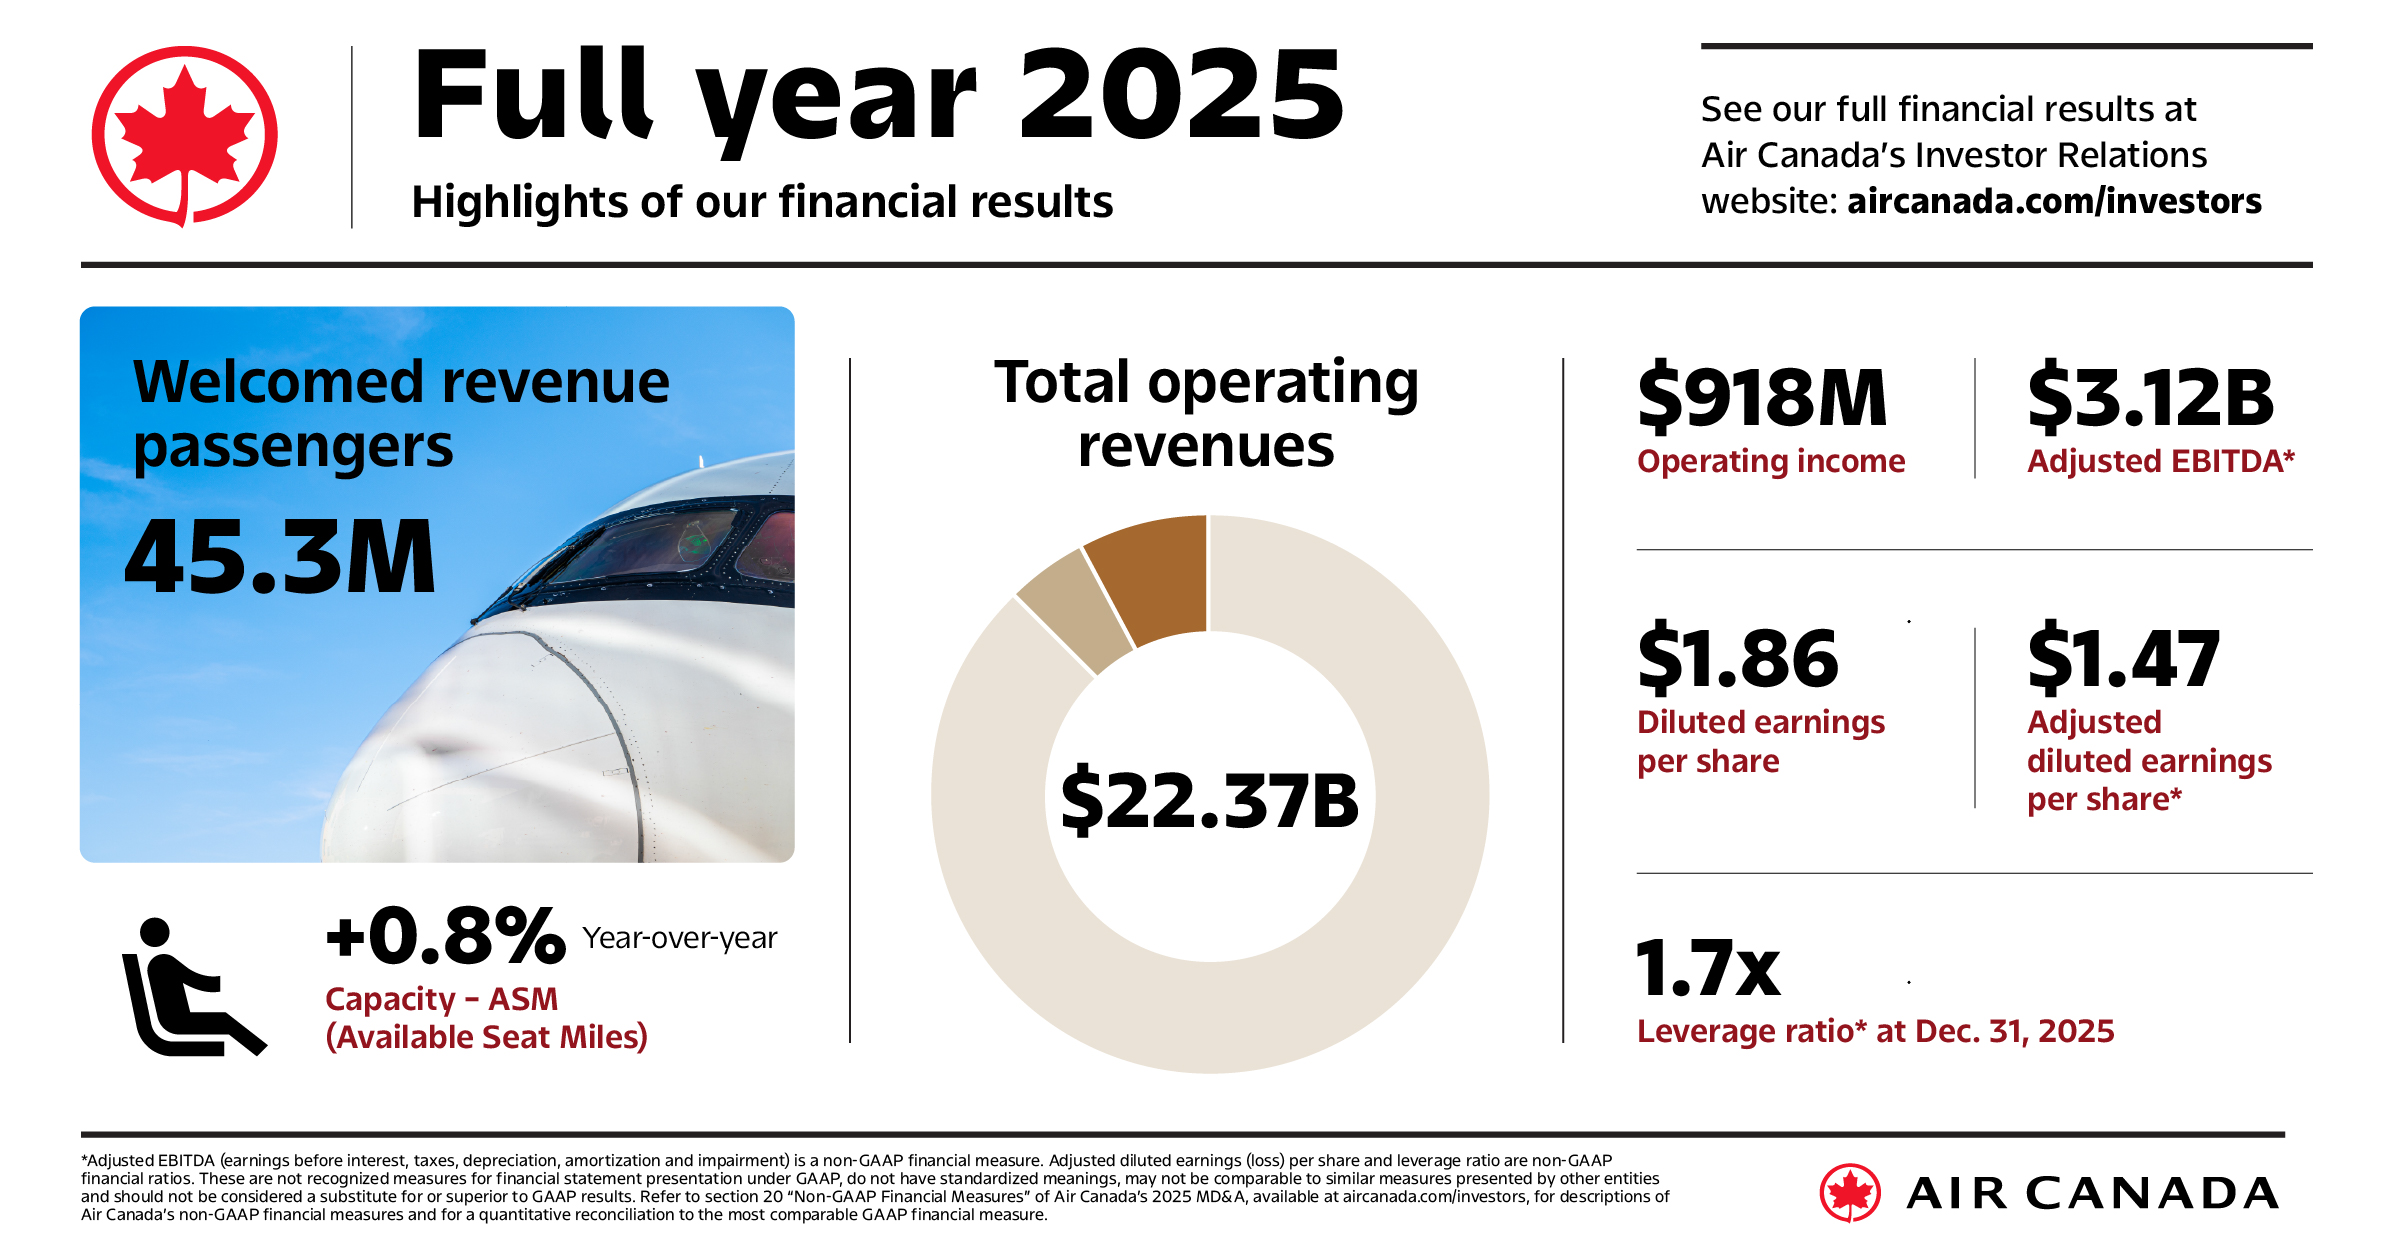
- Delivered record operating revenues of $5.8 billion in the fourth quarter of 2025, reaching $22.4 billion for the full year
- Operating income of $918 million and adjusted EBITDA* of $3.1 billion in 2025
- Generated $3.7 billion in net cash flows from operations and $747 million in free cash flow* in 2025, deployed over $850 million in share buybacks
- Improved operational performance and customer sentiment scores year over year, recognized as the Best Airline in North America at the 2025 Skytrax World Airline Awards
- Experiencing strong momentum in bookings versus last year
MONTREAL, Feb. 12, 2026 (GLOBE NEWSWIRE) -- Air Canada today reported its financial results for the fourth quarter and full year 2025 and provided its outlook for the full year 2026.
“Air Canada finished 2025 with a solid fourth quarter, delivering record revenues of $5.8 billion and achieving strong year‑over‑year earnings growth. For the full year, we generated $918 million in operating income and $3.1 billion in adjusted EBITDA. These results reflect our disciplined actions throughout the year, the strength of our commercial strategy, the loyalty of our customers, and—above all—the dedication and professionalism of our employees. I want to sincerely thank them for their hard work through a demanding year and through the severe cold and record snowfall of recent storms,” said Michael Rousseau, President and Chief Executive of Air Canada.
“We delivered these results while effectively managing shifting demand trends, a labour disruption in the summer, and continued macroeconomic and geopolitical uncertainty. We maintained our focus on operational reliability, advanced our cost‑reduction initiatives, and generated solid free cash flow, reinforcing the resilience of our business model and supporting disciplined capital allocation, including meaningful share repurchases.”
“As we look ahead to 2026, we are encouraged by the strong momentum in bookings and the opportunities created by our next phase of fleet investments. At the same time, we remain sharply focused on cost management, productivity, cash generation, and preserving balance‑sheet flexibility. Air Canada enters 2026 from a position of strength, and we remain committed to creating sustained value for our customers, employees, and shareholders,” said Mr. Rousseau.
*Adjusted CASM, adjusted EBITDA (earnings before interest, taxes, depreciation, amortization and impairment), adjusted EBITDA margin, leverage ratio, net debt, adjusted pre-tax income (loss), adjusted net income (loss), adjusted earnings (loss) per share – diluted, and free cash flow are referred to in this news release. Such measures are non-GAAP financial measures, non-GAAP ratios, or supplementary financial measures, are not recognized measures for financial statement presentation under GAAP, do not have standardized meanings, may not be comparable to similar measures presented by other entities and should not be considered a substitute for or superior to GAAP results. Refer to the "Non-GAAP Financial Measures" section of this news release for descriptions of these measures, and for a reconciliation of Air Canada non-GAAP measures used in this news release to the most comparable GAAP financial measure.
Fourth Quarter 2025 Financial Results
- Operating revenues of $5.770 billion
- Operating expenses of $5.446 billion
- Operating income of $324 million with an operating margin of 5.6% and adjusted EBITDA of $867 million with an adjusted EBITDA margin* of 15.0%
- Income before income taxes of $342 million and adjusted pre-tax income of $244 million
- Net income of $296 million and diluted earnings per share of $1.00
- Adjusted net income* of $191 million and adjusted earnings per diluted share of $0.65
- Adjusted CASM* of 15.34 cents
- Net cash flows from operating activities of $423 million and free cash flow of negative $478 million
Full Year 2025 Financial Results
- Operating revenues of $22.372 billion
- Operating expenses of $21.454 billion
- Operating income of $918 million with an operating margin of 4.1% and adjusted EBITDA of $3.124 billion with an adjusted EBITDA margin of 14.0%
- Income before income taxes of $789 million and adjusted pre-tax income of $658 million
- Net income of $644 million and diluted earnings per share of $1.86
- Adjusted net income of $471 million and adjusted earnings per diluted share of $1.47
- Adjusted CASM* of 14.72 cents
- Net cash flows from operating activities of $3.657 billion and free cash flow of $747 million
- Long-term debt and lease liabilities of $11.576 billion and leverage ratio* of 1.7x
Outlook
For the first quarter of 2026, Air Canada plans to increase its operated capacity by about 2.5 per cent from the same quarter in 2025.
Air Canada is providing the following guidance for the full year 2026.
| Metric | 2026 Guidance |
| Adjusted EBITDA | $3.35 billion to $3.75 billion |
| ASM capacity | 3.5% to 5.5% increase versus 2025 |
| Adjusted CASM | 15.05 ¢ to 15.35 ¢ |
| Free cash flow | $400 million to $800 million |
Major Assumptions
Air Canada made assumptions in providing its guidance—including a modest Canadian GDP growth for 2026. Air Canada assumes that the Canadian dollar will trade, on average, at C$1.36 per U.S. dollar for the full year 2026 and that the price of jet fuel will average C$0.90 per litre for the full year 2026.
Air Canada has entered into non-binding letters for up to $2 billion in sale and leaseback transactions scheduled to close in 2026 and 2027, subject to the execution of definitive and binding agreements and completion of standard conditions precedent. As part of the assumptions for 2026 guidance, Air Canada has assumed execution on its sale-leaseback transactions for $1 billion in 2026.
Air Canada’s guidance constitutes forward-looking information within the meaning of applicable securities laws and is subject to important risks and uncertainties, including in relation to statements or actions by governments and uncertainty relating to the imposition of (or threats to impose) tariffs on Canadian exports or imports and their resulting impacts on the Canadian, North American and global economies and travel demand. Please see the discussion below under Caution Regarding Forward-looking Information.
2028 targets and 2030 aspirations
Air Canada announced the following long-term 2028 financial targets and 2030 aspirations in December 2024:
| Metric | 2028 Targets | 2030 Aspirations |
| Operating revenues | Approximately $30 billion | Exceed $30 billion |
| Adjusted EBITDA margin* | Greater than or equal to 17% | Between 18% and 20% |
| Net cash flows from operating activities as a percentage of adjusted EBITDA* | Approximately 90% | Approximately 90% |
| Additions to property, equipment and intangible assets as a percentage of operating revenues* | Lower than or equal to 12% | Lower than 12% |
| Free cash flow margin* | Approximately 5% | Approximately 5% |
| Return on invested capital* | Not provided | Greater than or equal to 12% |
| Fully diluted share count | Lower than 300 million shares | Lower than 300 million shares |
*Adjusted EBITDA (earnings before interest, taxes, depreciation, amortization and impairment), adjusted EBITDA margin, net cash flows from operating activities as a percentage of adjusted EBITDA, additions to property, equipment and intangible assets as a percentage of operating revenues, free cash flow margin and return on invested capital are referred to in this news release. Such measures are non-GAAP financial measures, non-GAAP ratios, or supplementary financial measures, are not recognized measures for financial statement presentation under GAAP, do not have standardized meanings, may not be comparable to similar measures presented by other entities and should not be considered a substitute for or superior to GAAP results. Refer to the "Non-GAAP Financial Measures" section of this news release for descriptions of these measures, and for a reconciliation of Air Canada non-GAAP measures used in this news release to the most comparable GAAP financial measure.
The 2028 long-term targets and 2030 aspirations provided in this news release do not constitute guidance or outlook but rather are provided for the purpose of assisting the reader in measuring progress toward Air Canada’s objectives. Readers are cautioned that these targets and aspirations may change as conditions evolve and are referred to the assumptions, risks and uncertainties described in the 2024 Investor Day presentations which are available in the events section at aircanada.com/investors and elsewhere in this news release, including assumptions relating to increasing revenues, growing fleet and network capacity, and successfully executing on other key investments and initiatives.
Non-GAAP Financial Measures
Below is a description of certain non-GAAP financial measures and ratios used by Air Canada to provide readers with additional information on its financial and operating performance. Such measures are not recognized measures for financial statement presentation under GAAP, do not have standardized meanings, may not be comparable to similar measures presented by other entities and should not be considered a substitute for or superior to GAAP results. The non-GAAP financial measures or ratios described in this section typically have exclusions or adjustments that include one or more of the following characteristics, such as being highly variable, difficult to project, unusual in nature, significant to the results of a particular period or not indicative of past or future operating results. These items are excluded because the company believes these may distort the analysis of certain business trends and render comparative analysis across periods less meaningful and their exclusion generally allows for a more meaningful analysis of Air Canada’s operating expense performance and may allow for a more meaningful comparison to other airlines.
Air Canada excludes the effect of impairment of assets, if any, when calculating adjusted CASM, adjusted EBITDA, adjusted EBITDA margin, adjusted pre-tax income (loss) and adjusted net income (loss) as it may distort the analysis of certain business trends and render comparative analysis across periods or to other airlines less meaningful. Air Canada did not record charges for impairment of assets in 2025 or in 2024.
A charge of $34 million was recorded in the third quarter of 2024 in other operating expenses related to estimated costs associated with contractual lease obligations. Air Canada excluded this expense in computing adjusted CASM, adjusted EBITDA, adjusted pre-tax income and adjusted net income.
In 2025 Air Canada recorded a one-time pension past service cost and other labour related charges of $194 million, including from the pension plan amendments made in conjunction with the collective agreement reached with the Canadian Union of Public Employees (CUPE) and an operating expense related to the streamlining of Air Canada’s management structure. In 2024, with ratification of the collective agreement with the Air Line Pilots Association (ALPA), Air Canada recorded a one-time pension past service cost of $490 million in the fourth quarter of 2024. Air Canada has excluded these charges in computing its adjusted EBITDA, adjusted CASM, adjusted pre-tax income and adjusted net income.
Adjusted CASM
Air Canada uses adjusted CASM to assess the operating and cost performance of its ongoing airline business without the effects of aircraft fuel expense, the cost of ground packages at Air Canada Vacations, freighter costs and other items discussed above. These items may distort the analysis of certain business trends and render comparative analysis across periods less meaningful and their exclusion generally allows for a more meaningful analysis of Air Canada’s operating expense performance and may allow for a more meaningful comparison to that of other airlines.
In calculating adjusted CASM, aircraft fuel expense is excluded from operating expense results as it fluctuates widely depending on many factors, including international market conditions, geopolitical events, jet fuel refining costs and Canada/U.S. currency exchange rates. Air Canada also incurs expenses related to ground packages at Air Canada Vacations which some airlines, without comparable tour operator businesses, may not incur. In addition, these costs do not generate ASMs and therefore excluding these costs from operating expense results provides for a more meaningful comparison across periods when such costs may vary.
Air Canada also incurs expenses related to the operation of freighter aircraft which some airlines, without comparable cargo businesses, may not incur. Air Canada had six Boeing 767 dedicated freighter aircraft in service as at December 31, 2025, and as at December 31, 2024. These costs do not generate ASMs and therefore excluding these costs from operating expense results provides for a more meaningful comparison of the passenger airline business across periods.
The following tables provide the adjusted CASM reconciliation to GAAP operating expense for the periods indicated.
|
(Canadian dollars in millions, except where indicated) |
Fourth Quarter | Full Year | ||||||||||||||||
| 2025 | 2024 | Change | 2025 | 2024 | Change | |||||||||||||
| Operating expense – GAAP | $ | 5,446 | $ | 5,658 | $ | (212 | ) | $ | 21,454 | $ | 20,992 | $ | 462 | |||||
| Adjusted for: | ||||||||||||||||||
| Aircraft fuel | (1,185 | ) | (1,154 | ) | (31 | ) | (4,731 | ) | (5,118 | ) | 387 | |||||||
| Ground package costs | (239 | ) | (208 | ) | (31 | ) | (872 | ) | (782 | ) | (90 | ) | ||||||
| Freighter costs (excluding fuel) | (45 | ) | (50 | ) | 5 | (173 | ) | (163 | ) | (10 | ) | |||||||
| Provision for contractual lease obligations | - | - | - | - | (34 | ) | 34 | |||||||||||
| Pension plan amendments and other labor related charges | (21 | ) | (490 | ) | 469 | (194 | ) | (490 | ) | 296 | ||||||||
| Operating expense, adjusted for the above-noted items | $ | 3,956 | $ | 3,756 | $ | 200 | $ | 15,484 | 14,405 | 1,079 | ||||||||
| ASMs (millions) | 25,792 | 24,949 | 3.4 | % | 105,174 | 104,381 | 0.8 | % | ||||||||||
| Adjusted CASM (cents) | ¢ | 15.34 | ¢ | 15.05 | ¢ | 0.28 | ¢ | 14.72 | ¢ | 13.80 | ¢ | 0.92 | ||||||
Adjusted EBITDA and Adjusted EBITDA Margin
Adjusted EBITDA (earnings before interest, taxes, depreciation, amortization and impairment) and adjusted EBITDA margin (adjusted EBITDA as a percentage of operating revenues) are commonly used in the airline industry and are used by Air Canada as a means to view operating results and the related margin before interest, taxes, depreciation, amortization and impairment and other items discussed above. These items can vary significantly among airlines due to differences in the way airlines finance their aircraft and other assets.
Adjusted EBITDA and adjusted EBITDA margin are reconciled to GAAP operating income as follows:
|
(Canadian dollars in millions, except where indicated) |
Fourth Quarter | Full Year | ||||||||||||||||
|
2025 |
2024 | Change |
2025 |
2024 |
Change | |||||||||||||
| Operating income – GAAP | $ | 324 | $ | (254 | ) | $ | 578 | $ | 918 | $ | 1,263 | $ | (345 | ) | ||||
| Add back: | ||||||||||||||||||
| Depreciation, amortization and impairment | 522 | 460 | 62 | 2,012 | 1,799 | 213 | ||||||||||||
| Provision for contractual lease obligations | - | - | - | - | 34 | (34 | ) | |||||||||||
| Pension plan amendments and other labour related charges | 21 | 490 | (469 | ) | 194 | 490 | (296 | ) | ||||||||||
| Adjusted EBITDA | $ | 867 | $ | 696 | $ | 171 | $ | 3,124 | $ | 3,586 | $ | (462 | ) | |||||
| Operating revenues | $ | 5,770 | $ | 5,404 | $ | 366 | $ | 22,372 | $ | 22,255 | $ | 117 | ||||||
| Operating margin (%) | 5.6 | (4.7 | ) | 10.3 pp | 4.1 | 5.7 | (1.6) pp | |||||||||||
| Adjusted EBITDA margin (%) | 15.0 | 12.9 | 2.1 pp | 14.0 | 16.1 | (2.1) pp | ||||||||||||
Adjusted Pre-tax Income (Loss)
Adjusted pre-tax income (loss) is used by Air Canada to assess the overall pre-tax financial performance of its business without the effects of foreign exchange gains or losses, net interest relating to employee benefits, gains or losses on financial instruments recorded at fair value, gains or losses on sale and leaseback of assets, gains or losses on disposal of assets, gains or losses on debt settlements and modifications and other items discussed above. These items may distort the analysis of certain business trends and render comparative analysis across periods or to other airlines less meaningful.
A corporate charge of $26 million for the settlement of tax matters related to the 2019 acquisition of Aeroplan was recorded in 2025. As this item is non-recurring and cash-neutral to Air Canada, since a related tax refund was also recorded, it has been added back to adjusted pre-tax income.
Adjusted pre-tax income is reconciled to GAAP income before income taxes as follows:
| Fourth Quarter | Full Year | |||||||||||||||||
| 2025 | 2024 | Change | 2025 | 2024 | Change | |||||||||||||
| Income (loss) before income taxes – GAAP | $ | 342 | $ | (721 | ) | $ | 1,063 | $ | 789 | $ | 515 | $ | 274 | |||||
| Adjusted for: | ||||||||||||||||||
| Provision for contractual lease obligations | - | - | - | - | 34 | (34 | ) | |||||||||||
| Pension plan amendments and other labour related charges | 21 | 490 | (469 | ) | 194 | 490 | (296 | ) | ||||||||||
| Foreign exchange (gain) loss | (103 | ) | 372 | (475 | ) | (245 | ) | 400 | (645 | ) | ||||||||
| Net interest relating to employee benefits | (10 | ) | (6 | ) | (4 | ) | (24 | ) | (22 | ) | (2 | ) | ||||||
| (Gain) loss on financial instruments recorded at fair value | (6 | ) | 38 | (44 | ) | (82 | ) | (28 | ) | (54 | ) | |||||||
| (Gain) loss on debt settlement | - | (38 | ) | 38 | - | 8 | (8 | ) | ||||||||||
| Other corporate expenses | - | - | - | 26 | - | 26 | ||||||||||||
| Adjusted pre-tax income | $ | 244 | $ | 135 | $ | 109 | $ | 658 | $ | 1,397 | $ | (739 | ) | |||||
Adjusted Net Income (Loss) and Adjusted Earnings (Loss) Per Share – Diluted
Air Canada uses adjusted net income (loss) and adjusted earnings (loss) per share – diluted as a means to assess the overall financial performance of its business without the after-tax effects of foreign exchange gains or losses, net financing expense relating to employee benefits, gains or losses on financial instruments recorded at fair value, gains or losses on sale and leaseback of assets, gains or losses on debt settlements and modifications, gains or losses on disposal of assets and other items discussed above. These items may distort the analysis of certain business trends and render comparative analysis to other airlines less meaningful.
A corporate charge of $26 million for the settlement of tax matters related to the 2019 acquisition of Aeroplan was recorded in 2025. As this item is non-recurring and cash-neutral to Air Canada, since a related tax refund was also recorded, it has been added back to adjusted net income.
Adjusted net income and adjusted earnings per share – diluted are reconciled to GAAP net income as follows:
| Fourth Quarter | Full Year | |||||||||||||||||
|
2025 |
2024 |
Change |
2025 |
2024 |
Change | |||||||||||||
| Net income (loss) – GAAP | $ | 296 | $ | (644 | ) | $ | 940 | $ | 644 | $ | 1,720 | $ | (1,076 | ) | ||||
| Adjusted for: | ||||||||||||||||||
| Provision for contractual lease obligations | - | - | - | - | 34 | (34 | ) | |||||||||||
| Pension plan amendments and other labour related charges | 21 | 490 | (469 | ) | 194 | 490 | (296 | ) | ||||||||||
| Foreign exchange (gain) loss | (103 | ) | 372 | (475 | ) | (245 | ) | 400 | (645 | ) | ||||||||
| Net interest relating to employee benefits | (10 | ) | (6 | ) | (4 | ) | (24 | ) | (22 | ) | (2 | ) | ||||||
| (Gain) loss on financial instruments recorded at fair value | (6 | ) | 38 | (44 | ) | (82 | ) | (28 | ) | (54 | ) | |||||||
| (Gain) loss on debt settlements and modifications | - | (38 | ) | 38 | - | 8 | (8 | ) | ||||||||||
| Other corporate expenses | - | - | - | 26 | - | 26 | ||||||||||||
| Income tax, including for the above reconciling items(1) | (7 | ) | (119 | ) | 112 | (42 | ) | (1,267 | ) | 1,225 | ||||||||
| Adjusted net income | $ | 191 | $ | 93 | $ | 98 | $ | 471 | $ | 1,335 | $ | (864 | ) | |||||
| Weighted average number of outstanding shares used in computing diluted income per share (in millions) | 296 | 374 | (78 | ) | 320 | 376 | (56 | ) | ||||||||||
| Adjusted earnings per share – diluted | $ | 0.65 | $ | 0.25 | $ | 0.40 | $ | 1.47 | $ | 3.55 | $ | (2.08 | ) | |||||
The table below reflects the share amounts used in the computation of basic and diluted earnings per share on an adjusted earnings per share basis:
|
(In millions) |
Fourth Quarter |
Full Year |
||||||
|
2025 |
2024 |
2025 |
2024 |
|||||
| Weighted average number of shares outstanding – basic | 296 | 355 | 311 | 358 | ||||
| Effect of dilution | - | 19 | 9 | 18 | ||||
| Weighted average number of shares outstanding – diluted | 296 | 374 | 320 | 376 | ||||
Free Cash Flow
Air Canada uses free cash flow as an indicator of the financial strength and performance of its business, indicating the amount of cash Air Canada can generate from operations and after capital expenditures. Free cash flow is calculated as net cash flows from operating activities minus additions to property, equipment, and intangible assets, and is net of proceeds from sale and leaseback transactions.
The table below reconciles free cash flow to net cash flows from (used in) operating activities for the periods indicated.
|
(Canadian dollars in millions) |
Fourth Quarter | Full Year | ||||||||||||||||
|
2025 |
2024 |
$ Change |
2025 |
2024 |
$ Change | |||||||||||||
| Net cash flows from operating activities | $ | 423 | $ | 677 | $ | (254 | ) | $ | 3,657 | $ | 3,930 | $ | (273 | ) | ||||
| Additions to property, equipment, and intangible assets | (901 | ) | (1,172 | ) | 271 | (2,910 | ) | (2,636 | ) | (274 | ) | |||||||
| Free cash flow | $ | (478 | ) | $ | (495 | ) | $ | 17 | $ | 747 | $ | 1,294 | $ | (547 | ) | |||
Net Debt
Net debt is a capital management measure and a key component of the capital managed by Air Canada and provides management with a measure of its net indebtedness.
Net Debt to Trailing 12-Month Adjusted EBITDA (Leverage Ratio)
Net debt to trailing 12-month adjusted EBITDA ratio (also referred to as “leverage ratio”) is commonly used in the airline industry and is used by Air Canada as a means to measure financial leverage. Leverage ratio is calculated by dividing net debt by trailing 12-month adjusted EBITDA.
The table below reconciles leverage ratio to Air Canada’s net debt balances as at the dates indicated.
| (Canadian dollars in millions) | December 31, 2025 | December 31, 2024 | ||||
| Total long-term debt and lease liabilities | $ | 8,609 | $ | 10,915 | ||
| Current portion of long-term debt and lease liabilities | 2,967 | 1,755 | ||||
| Total long-term debt and lease liabilities (including current portion) | 11,576 | 12,670 | ||||
| Less cash, cash equivalents and short- and long-term investments | (6,165 | ) | (7,752 | ) | ||
| Net debt | $ | 5,411 | $ | 4,918 | ||
| Adjusted EBITDA (trailing 12 months) | $ | 3,124 | $ | 3,586 | ||
| Net debt to adjusted EBITDA ratio | 1.7 | 1.4 | ||||
The tables below present comparative figures for the twelve-month periods ending December 31, 2024 and 2025, in reference to Air Canada's full-year 2026 guidance, 2028 financial targets, and 2030 aspirations.
| (Canadian dollars in millions, except where indicated) | 2025 Results | 2024 Results |
| ASM Capacity | 105.174 billion | 104.381 billion |
| Adjusted CASM (cents) | 14.72¢ | 13.80¢ |
| Operating expenses | $21.454 billion | $20.992 billion |
| Adjusted EBITDA | $3.124 billion | $3.586 billion |
| Operating income | $918 million | $1.263 billion |
| Free cash flow | $747 million | $1.294 billion |
| Net cash flows from operating activities | $3.657 billion | $3.930 billion |
| (Canadian dollars in millions, except where indicated) | 20251 | 20241 |
| Operating revenues | $22.372 billion | $22.255 billion |
| Adjusted EBITDA margin | 14% | 16% |
| Operating margin | 4% | 6% |
| Net cash flows from operating activities as a percentage of adjusted EBITDA | 117% | 110% |
| Additions to property, equipment and intangible assets as a percentage of operating revenues | 13% | 12% |
| Free cash flow margin | 3% | 6% |
| Return on invested capital | 9% | 14% |
| Income before income taxes | $789 million | $515 million |
| Fully diluted share count | Approximately 307 million shares | Approximately 376 million shares |
1Percentage amounts in the table above may not calculate exactly due to rounding.
Net cash flows from operating activities as a percentage of adjusted EBITDA
Air Canada uses net cash flows from operating activities as a percentage of adjusted EBITDA to measure cash conversion from adjusted EBITDA. This measure is defined as the ratio of net cash flows from operating activities to adjusted EBITDA.
Additions to property, equipment and intangible assets as a percentage of operating revenues
Air Canada uses additions to property, equipment and intangible assets as a percentage of operating revenues to measure the proportion of operating revenues that are reinvested as capital expenditures. This measure is defined as the ratio of additions to property, equipment and intangible assets to operating revenues.
Free cash flow margin
Air Canada uses free cash flow margin to measure the amount its free cash flow represents as a percentage of operating revenues. This measure is defined as the ratio of free cash flow to operating revenues.
The table below presents the quantitative reconciliation for adjusted EBITDA, adjusted EBITDA margin, net cash flows from operating activities as a percentage of adjusted EBITDA, additions to property, equipment and intangible assets as a percentage of operating revenues, free cash flow and free cash flow margin, in each case for the financial years ended December 31, 2025 and 2024.
| (in millions, except where indicated) | 2025 | 2024 | ||||
| Total operating revenues – GAAP | $ | 22,372 | $ | 22,255 | ||
| Operating income – GAAP | $ | 918 | $ | 1,263 | ||
| Add back: | ||||||
| Depreciation, amortization and impairment | 2,012 | 1,799 | ||||
| Provision for contractual lease obligations | - | 34 | ||||
| Pension plan amendments and other labour related charges | 194 | 490 | ||||
| Adjusted EBITDA | $ | 3,124 | $ | 3,586 | ||
| Net cash flows from operating activities | $ | 3,657 | $ | 3,930 | ||
| Additions to property, equipment and intangible assets | (2,910 | ) | (2,636 | ) | ||
| Free cash flow | $ | 747 | $ | 1,294 | ||
| Operating margin | 4 | % | 6 | % | ||
| Adjusted EBITDA margin | 14 | % | 16 | % | ||
| Net cash flows from operating activities as a percentage of adjusted EBITDA | 117 | % | 110 | % | ||
| Additions to property, equipment and intangible assets as a percentage of operating revenues | 13 | % | 12 | % | ||
| Free cash flow margin | 3 | % | 6 | % | ||
Return on invested capital
Air Canada uses return on invested capital (ROIC) to assess the efficiency with which it allocates its capital to generate returns. ROIC is calculated as the ratio of adjusted pre-tax income (loss), excluding interest expense, to invested capital. Invested capital includes average year-over-year long-term debt and lease obligations, average year-over-year shareholders' equity, and the embedded derivative on Air Canada's convertible notes. In 2020, Air Canada issued convertible unsecured notes. Air Canada had the option to deliver cash or a combination of cash and shares on the conversion date in lieu of shares, giving rise to an embedded derivative that was included as part of the definition of capital. Air Canada calculates invested capital on a book value-based method when calculating ROIC.
Return on invested capital is reconciled to GAAP income (loss) before income taxes as follows:
| (in millions, except where indicated) | 2025 | 2024 | ||||
| Income before income taxes – GAAP | $ | 789 | $ | 515 | ||
| Adjusted for: | ||||||
| Provision for contractual lease obligations | - | 34 | ||||
| Pension plan amendments and other labour related charges | 194 | 490 | ||||
| Foreign exchange (gain) loss | (245 | ) | 400 | |||
| Net interest relating to employee benefits | (24 | ) | (22 | ) | ||
| Gain on financial instruments recorded at fair value | (82 | ) | (28 | ) | ||
| Loss on debt settlements and modifications | - | 8 | ||||
| Other corporate expenses | 26 | - | ||||
| Adjusted pre-tax income | $ | 658 | $ | 1,397 | ||
| Add back: | ||||||
| Interest expense | 663 | 763 | ||||
| Adjusted pre-tax income before interest expense | $ | 1,321 | $ | 2,160 | ||
| Invested capital: | ||||||
| Average long-term debt and lease liabilities (including current portion) | 12,123 | 13,266 | ||||
| Embedded derivative on convertible notes | - | 45 | ||||
| Average shareholders’ equity | 2,490 | 1,592 | ||||
| Invested capital | $ | 14,613 | $ | 14,903 | ||
| Return on invested capital (%) | 9 | % | 14 | % | ||
Fourth Quarter 2025 Conference Call
Air Canada will host its quarterly analysts’ call on Friday, February 13, 2026 at 7:30 AM ET. Michael Rousseau, President and Chief Executive Officer, John Di Bert, Executive Vice President and Chief Financial Officer, and Mark Galardo, Executive Vice President and Chief Commercial Officer and President, Cargo, will present the results and be available for analysts' questions. Immediately following the analysts' Q&A session, Mr. Di Bert and Pierre Houle, Vice President and Treasurer, will be available to answer questions from term loan B lenders and holders of Air Canada bonds.
Media and the public may access this call on a listen-in basis. Details are as follows:
| Webcast: | https://edge.media-server.com/mmc/p/mf54qyqy | |
| By telephone: | 647-932-3411 or 1-800-715-9871 (toll-free) | |
| Conference ID 8728747 | ||
| Please allow 10 minutes to be connected to the conference call. |
CAUTION REGARDING FORWARD-LOOKING INFORMATION
This news release includes forward-looking statements within the meaning of applicable securities laws. Forward-looking statements relate to analyses and other information that are based on forecasts of future results and estimates of amounts not yet determinable. These statements may involve, but are not limited to, comments relating to strategies, expectations, planned operations or future actions or to Air Canada's full-year 2026 guidance, 2028 financial targets and 2030 aspirations. Forward-looking statements are identified using terms and phrases such as "preliminary"; "anticipate"; "believe"; "could"; "estimate"; "expect"; "intend"; "may"; "plan"; "predict"; "project"; "will"; "would"; and similar terms and phrases, including references to assumptions.
Forward-looking statements, by their nature, are based on assumptions including those described herein and are subject to important risks and uncertainties. Forward-looking statements cannot be relied upon due to, among other things, changing external events and general uncertainties of the business of Air Canada. Actual results may differ materially from results indicated in forward-looking statements due to a number of factors, including those discussed below.
Factors that may cause results to differ materially from results indicated in forward-looking statements include economic conditions, statements or actions by governments and uncertainty relating to the imposition of (or threats to impose) tariffs on Canadian exports or imports and their resulting impacts on the Canadian, North American and global economies and travel demand, geopolitical and security conditions including in relation to the military conflicts in the Middle East and between Russia and Ukraine, Air Canada’s ability to successfully achieve or sustain positive net profitability, industry and market conditions and the demand environment, competition, Air Canada’s dependence on technology, cybersecurity risks, interruptions of service, climate change and environmental factors (including weather systems and other natural phenomena and factors arising from anthropogenic sources), Air Canada’s dependence on key suppliers (including government agencies and other stakeholders supporting airport and airline operations), employee and labour relations and costs, Air Canada’s ability to successfully implement appropriate strategic and other important initiatives (including Air Canada’s ability to manage operating costs), energy prices, Air Canada’s ability to pay its indebtedness and maintain or increase liquidity, Air Canada’s dependence on regional and other carriers, Air Canada’s ability to attract and retain required personnel, epidemic diseases, changes in laws, regulatory developments or proceedings, terrorist acts, war, Air Canada’s ability to successfully operate its loyalty program, casualty losses, Air Canada’s dependence on Star Alliance® and joint ventures, Air Canada’s ability to preserve and grow its brand, pending and future litigation and actions by third parties, currency exchange fluctuations, limitations due to restrictive covenants, insurance issues and costs, and pension plan obligations as well as the factors identified in Air Canada’s public disclosure file available at www.sedarplus.ca and, in particular, those identified in section 18 “Risk Factors” of Air Canada’s 2025 MD&A.
Air Canada has and continues to establish targets, make commitments and assess the impact regarding climate change, and related initiatives, plans and proposals that Air Canada and other stakeholders (including government, regulatory and other bodies) are pursuing in relation to climate change and carbon emissions. The achievement of our commitments and targets depends on many factors, including the combined actions of governments, industry, suppliers and other stakeholders and actors, as well as the development and implementation of new technologies. In particular, our 2030 carbon emission-related targets and our related 2050 aspiration are ambitious and heavily dependent on new technologies, renewable energies and the availability of a sufficient supply of sustainable aviation fuels (SAF), which continues to present serious challenges. In addition, Air Canada has incurred, and expects to continue to incur, costs to achieve its goal of net-zero carbon emissions and to comply with environmental sustainability legislation and regulation and other standards and accords. The precise nature of future binding or non-binding legislation, regulation, standards and accords, on which local and international stakeholders are increasingly focusing, cannot be predicted with any degree of certainty, nor can their financial, operational or other impact. There can be no assurance of the extent to which any of our climate goals will be achieved or that any future investments that we make in furtherance of achieving our climate goals will produce the expected results or meet increasing stakeholder environmental, social and governance expectations. Moreover, future events could lead Air Canada to prioritize other nearer-term interests over progressing toward our current climate goals based on business strategy, economic, regulatory and social factors, and potential pressure from investors, activist groups or other stakeholders. If we are unable to meet or properly report on our progress toward achieving our climate change goals and commitments, we could face adverse publicity and reactions from investors, customers, advocacy groups or other stakeholders, which could result in reputational harm or other adverse effects to Air Canada.
The forward-looking statements contained or incorporated by reference in this news release represent Air Canada's expectations as of the date of this news release (or as of the date they are otherwise stated to be made) and are subject to change after such date. However, Air Canada disclaims any intention or obligation to update or revise any forward-looking statements whether because of new information, future events or otherwise, except as required under applicable securities regulations.
| Contacts: | media@aircanada.ca |
| Internet: | aircanada.com/media |
Read our annual report Here
Sign up for Air Canada news: aircanada.com
Media Resources:
Photos
Videos
B-Roll
Articles
Selected Financial Metrics and Statistics
The financial and operating highlights for Air Canada for the periods indicated are as follows:
| (Canadian dollars in millions, except per share figures or where indicated) | Fourth Quarter | Full Year | ||||
| Financial Performance Metrics | 2025 | 2024 | $ Change | 2025 | 2024 | $ Change |
| Operating revenues | 5,770 | 5,404 | 366 | 22,372 | 22,255 | 117 |
| Operating income (loss) | 324 | (254) | 578 | 918 | 1,263 | (345) |
| Operating margin(1)(%) | 5.6 | (4.7) | 10.3 pp(8) | 4.1 | 5.7 | (1.6) pp |
| Adjusted EBITDA(2) | 867 | 696 | 171 | 3,124 | 3,586 | (462) |
| Adjusted EBITDA margin(2)(%) | 15.0 | 12.9 | 2.1 pp | 14.0 | 16.1 | (2.1) pp |
| Income (loss) before income taxes | 342 | (721) | 1,063 | 789 | 515 | 274 |
| Net income (loss) | 296 | (644) | 940 | 644 | 1,720 | (1,076) |
| Adjusted pre-tax income(2) | 244 | 135 | 109 | 658 | 1,397 | (739) |
| Adjusted net income(2) | 191 | 93 | 98 | 471 | 1,335 | (864) |
| Total liquidity(3) | 7,500 | 9,154 | (1,654) | 7,500 | 9,154 | (1,654) |
| Net cash flows from operating activities | 423 | 677 | (254) | 3,657 | 3,930 | (273) |
| Free cash flow(2) | (478) | (495) | 17 | 747 | 1,294 | (547) |
| Net debt(2) | 5,411 | 4,918 | 493 | 5,411 | 4,918 | 493 |
| Long-term debt and lease liabilities | 11,576 | 12,670 | (1,094) | 11,576 | 12,670 | (1,094) |
| Diluted earnings (loss) per share | 1.00 | (1.81) | 2.81 | 1.86 | 4.72 | (2.86) |
| Adjusted earnings per share – diluted(2) | 0.65 | 0.25 | 0.40 | 1.47 | 3.55 | (2.08) |
| Operating Statistics(4) | 2025 | 2024 | % Change | 2025 | 2024 | % Change |
| Revenue passenger miles (RPMs) (millions) | 21,879 | 20,573 | 6.3 | 89,021 | 88,643 | 0.4 |
| Available seat miles (ASMs) (millions) | 25,792 | 24,949 | 3.4 | 105,174 | 104,381 | 0.8 |
| Passenger load factor % | 84.8% | 82.5% | 2.4 pp | 84.6% | 84.9% | (0.3) pp |
| Passenger revenue per RPM (Yield) (cents) | 22.8 | 23.0 | (0.6) | 22.0 | 22.3 | (1.2) |
| Passenger revenue per ASM (PRASM) (cents) | 19.4 | 18.9 | 2.3 | 18.6 | 18.9 | (1.5) |
| Operating revenue per ASM (TRASM) (cents) | 22.4 | 21.7 | 3.3 | 21.3 | 21.3 | (0.2) |
| Operating expense per ASM (CASM) (cents) | 21.1 | 22.7 | (6.9) | 20.4 | 20.1 | 1.4 |
| Adjusted CASM (cents)(2) | 15.3 | 15.1 | 1.9 | 14.7 | 13.8 | 6.7 |
| Average number of full-time-equivalent (FTE) employees (thousands)(5) | 36.4 | 37.1 | (1.9) | 37.0 | 37.1 | (0.4) |
| Aircraft in operating fleet at period-end | 353 | 354 | (0.3) | 353 | 354 | (0.3) |
| Seats dispatched (thousands) | 13,675 | 13,796 | (0.9) | 56,587 | 56,745 | (0.3) |
| Aircraft frequencies (thousands) | 93.0 | 94.5 | (1.6) | 385.7 | 387.9 | (0.6) |
| Average stage length (miles)(6) | 1,886 | 1,808 | 4.3 | 1,859 | 1,839 | 1.0 |
| Fuel cost per litre (cents) | 91.7 | 94.6 | (3.1) | 91.4 | 100.6 | (9.1) |
| Fuel litres (thousands) | 1,244,669 | 1,225,281 | 1.6 | 5,064,561 | 5,082,636 | (0.4) |
| Revenue passengers carried (thousands)(7) | 11,195 | 10,929 | 2.4 | 45,297 | 45,886 | (1.3) |
| (1) | Operating margin is a supplementary financial measure and is defined as operating income (loss) as a percentage of operating revenues. | |
| (2) | Adjusted EBITDA (earnings before interest, taxes, depreciation, amortization and impairment), adjusted EBITDA margin, adjusted pre-tax income (loss), adjusted net income (loss), free cash flow, net debt, adjusted earnings (loss) per share, and adjusted CASM are non-GAAP financial measures, capital management measures, non-GAAP ratios or supplementary financial measures. Such measures are not recognized measures for financial statement presentation under GAAP, do not have standardized meanings, may not be comparable to similar measures presented by other entities and should not be considered a substitute for or superior to GAAP results. Refer to section “Non-GAAP Financial Measures” of this release for descriptions of Air Canada’s non-GAAP financial measures and for a quantitative reconciliation of Air Canada’s non-GAAP financial measures to the most comparable GAAP measure. | |
| (3) | Total liquidity refers to the sum of cash, cash equivalents, short and long-term investments, and the amounts available under Air Canada’s credit facilities. Total liquidity, as at December 31, 2025, of $7,500 million, consisted of $6,165 million in cash, cash equivalents, and short‑ and long‑term investments, and $1,335 million available under undrawn credit facilities. As at December 31, 2024, total liquidity of $9,154 million consisted of $7,752 million in cash, cash equivalents, short- and long-term investments and $1,402 million available under undrawn credit facilities. These amounts also include funds ($333 million as at December 31, 2025 and $346 million as at December 31, 2024) held in trust by Air Canada Vacations in accordance with regulatory requirements governing advance sales for tour operators. | |
| (4) | Except for the reference to average number of full-time equivalent (FTE) employees, operating statistics in this table include third party carriers operating under capacity purchase agreements with Air Canada. | |
| (5) | Reflects FTE employees at Air Canada and its subsidiaries. Excludes FTE employees at third-party carriers operating under capacity purchase agreements with Air Canada. | |
| (6) | Average stage length is calculated by dividing the total number of available seat miles by the total number of seats dispatched. | |
| (7) | Revenue passengers are counted on a flight number basis (rather than by journey/itinerary or by leg), which is consistent with the IATA definition of revenue passengers carried. | |
| (8) | Percentage point, or “pp”, is a measure of the arithmetic / absolute difference between two percentages. |
A photo accompanying this announcement is available at https://www.globenewswire.com/NewsRoom/AttachmentNg/b8f78ace-909e-4c32-90b9-c863c17f2bfd

![]()
Air Canada Reports Fourth Quarter and Full Year 2025 Financial Results

Air Canada today reported its financial results for the fourth quarter and full year 2025 and provided its outlook for the full year 2026.
Legal Disclaimer:
EIN Presswire provides this news content "as is" without warranty of any kind. We do not accept any responsibility or liability for the accuracy, content, images, videos, licenses, completeness, legality, or reliability of the information contained in this article. If you have any complaints or copyright issues related to this article, kindly contact the author above.
